|
AIM
FEATURED DATA ARCHIVE
21 August 2009
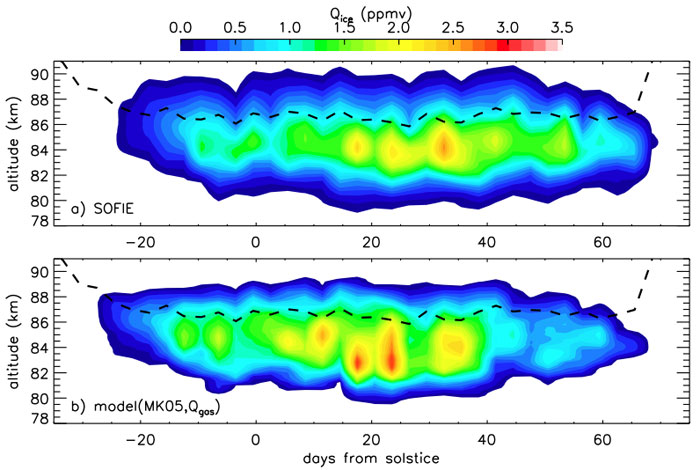
This figure compares time versus height cross sections of ice abundance (expressed as the gas phase equivalent mixing ratio, Qice) from a) SOFIE observations and from b) a thermodynamic equilibrium model using SOFIE temperatures and water vapor as input. The results are based on 3-day averages and dashed lines indicate the mesopause height. The good agreement between SOFIE and the model suggests that on average PMCs exist in equilibrium with the surrounding environment.
Credit: Solar Occultation for Ice Experiment Data Processing Team at GATS, Inc.

|
